
Spot what deserves attention.
Compare targets and the available technical context across the daily selection. Filter by date and available indicators in your member dashboard.
Compare selected U.S. stock setups at a glance. Statistical targets, technical context, chart previews and progress — together, before you open the full analysis.
Start my Elite trial →Compare targets and the available technical context across the daily selection. Filter by date and available indicators in your member dashboard.
Inspect price action, candle patterns, key levels and indicators in the PowerChart.
White cards remain OPEN. Black and gold cards identify confirmed target hits.
5,000+ U.S. stocks screened every trading evening. Compare the setups, then open the analysis that deserves your attention.
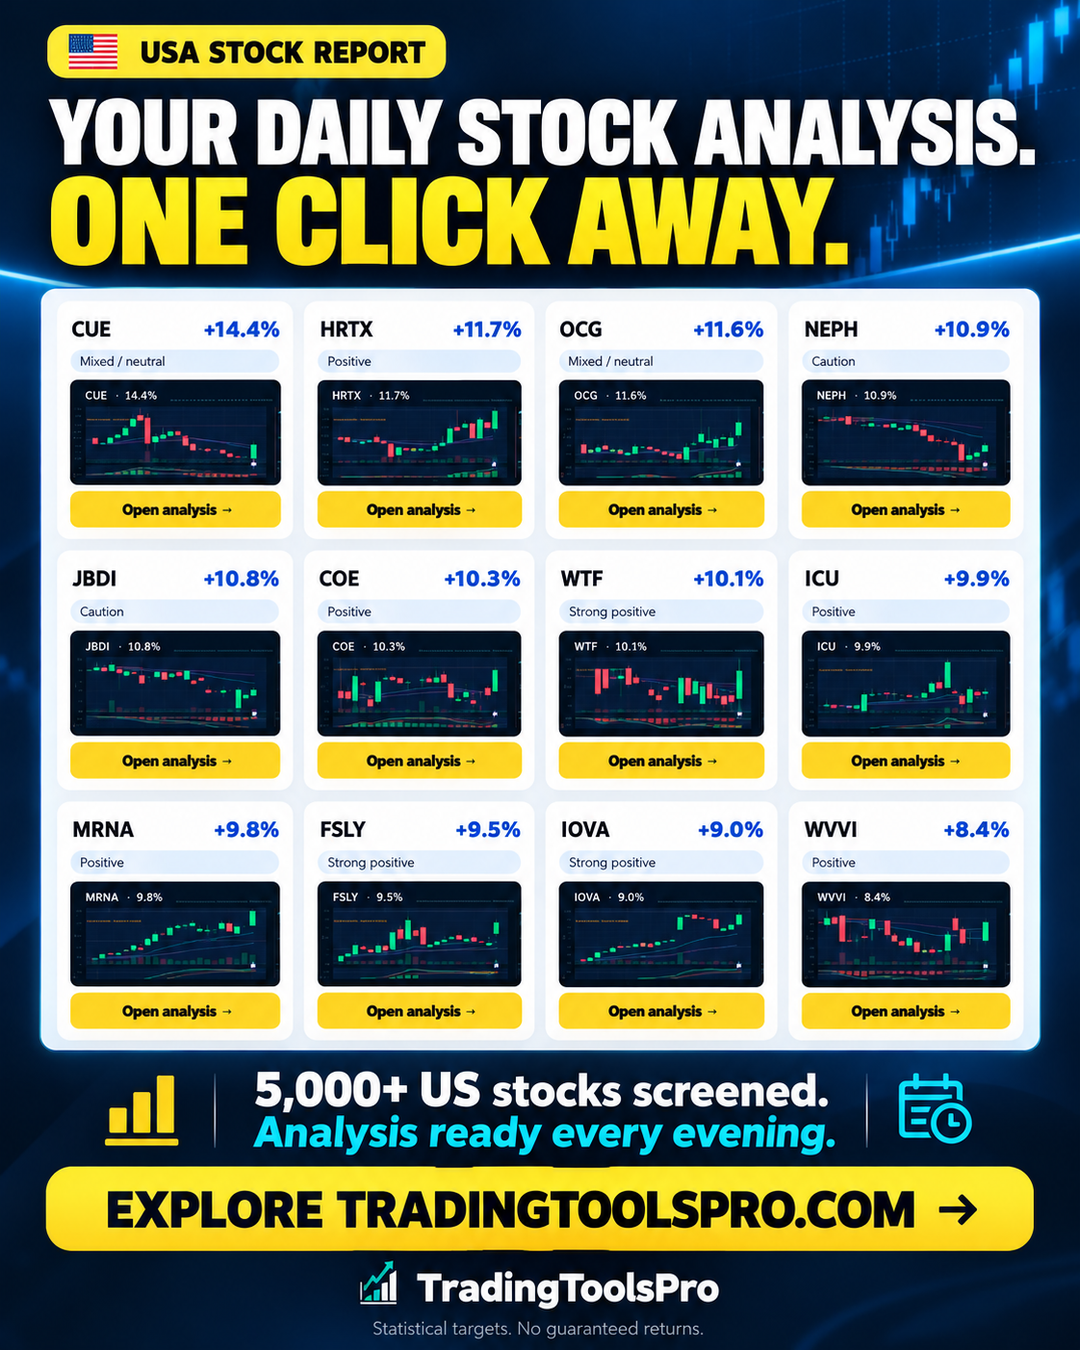
Historical setup date: 2026-02-24. All setups from this signal day, including confirmed HIT and still OPEN outcomes.
Cumulative status in this generated report. Build date: 2026-10-26. The latest outcome observation date is not supplied by this dataset; build date is not the measurement date. This is not a five-session hit rate or a realized return.
Historical chart unavailable for this signal.
Open real PowerChart →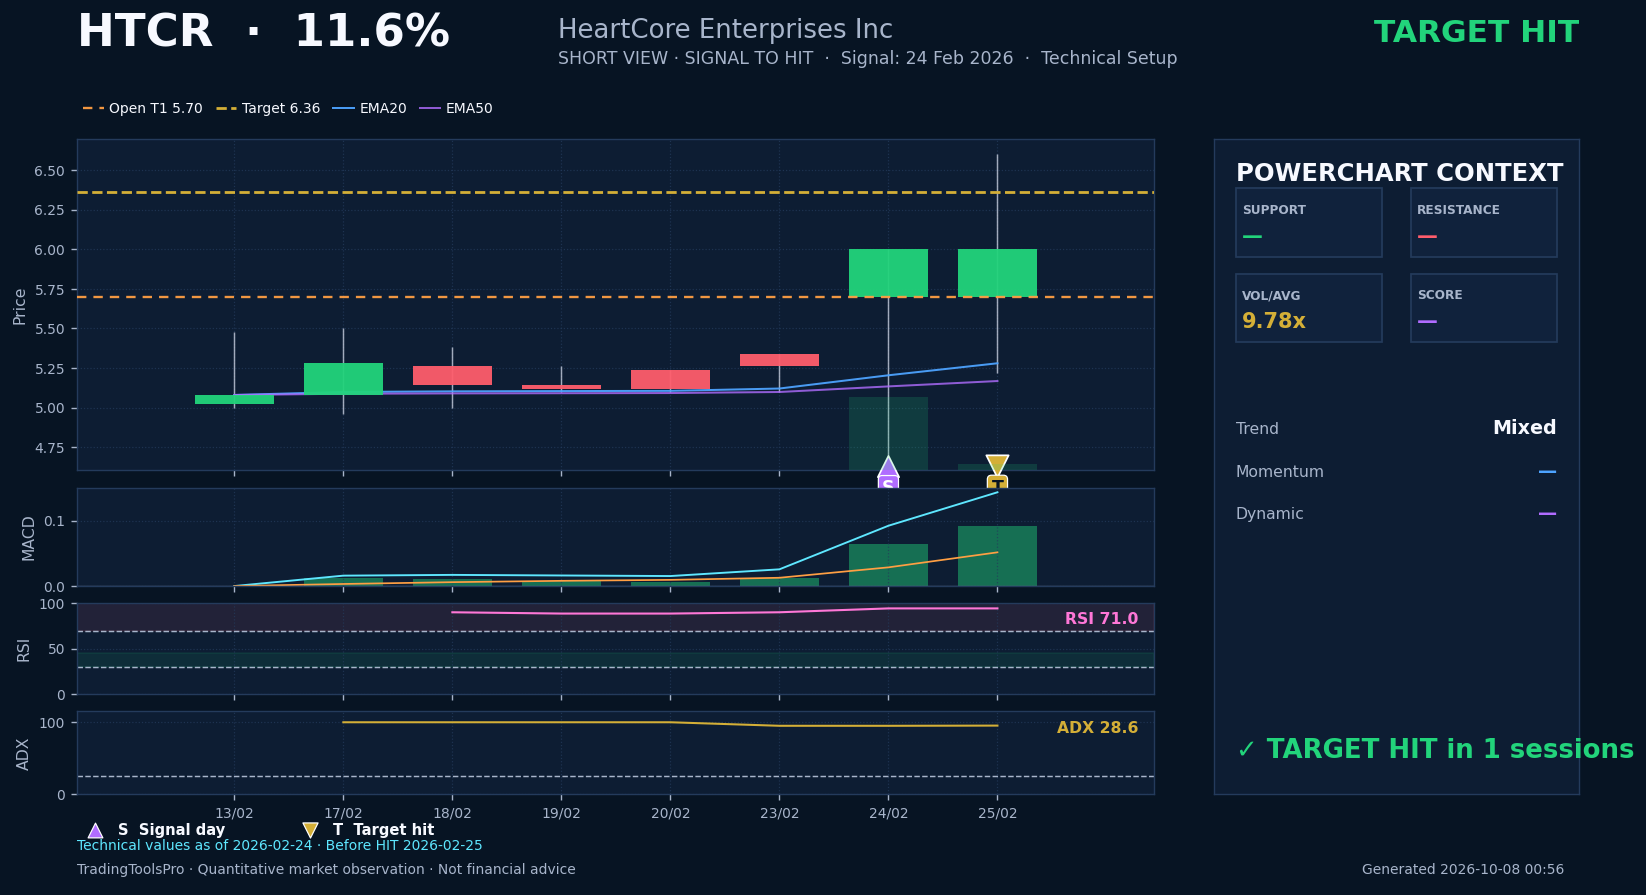 Open real PowerChart →
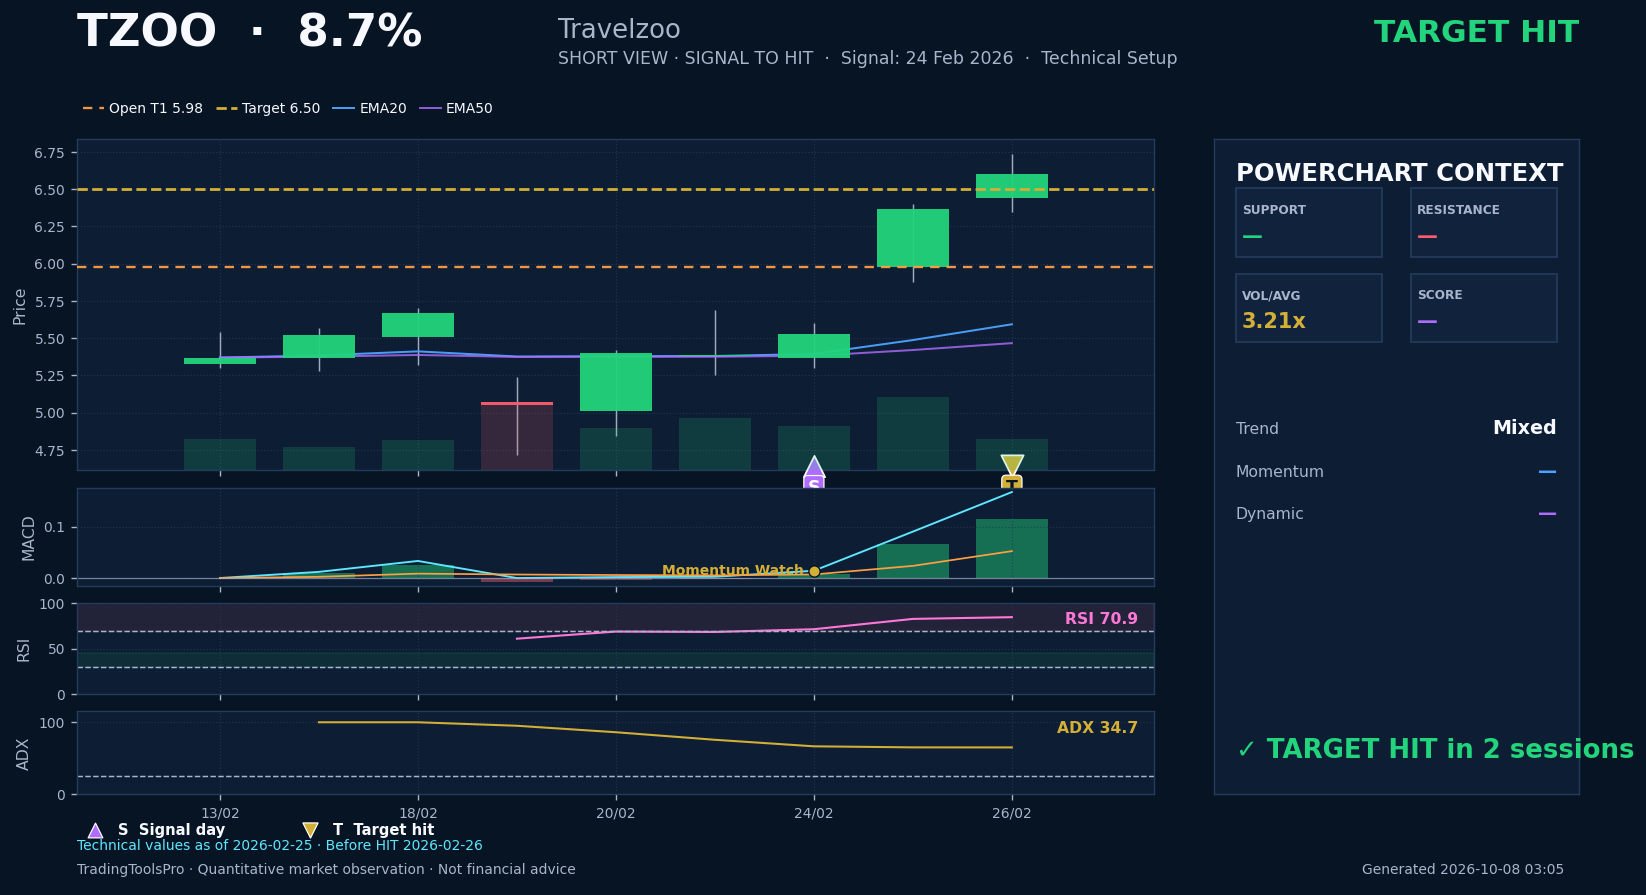 Open real PowerChart →
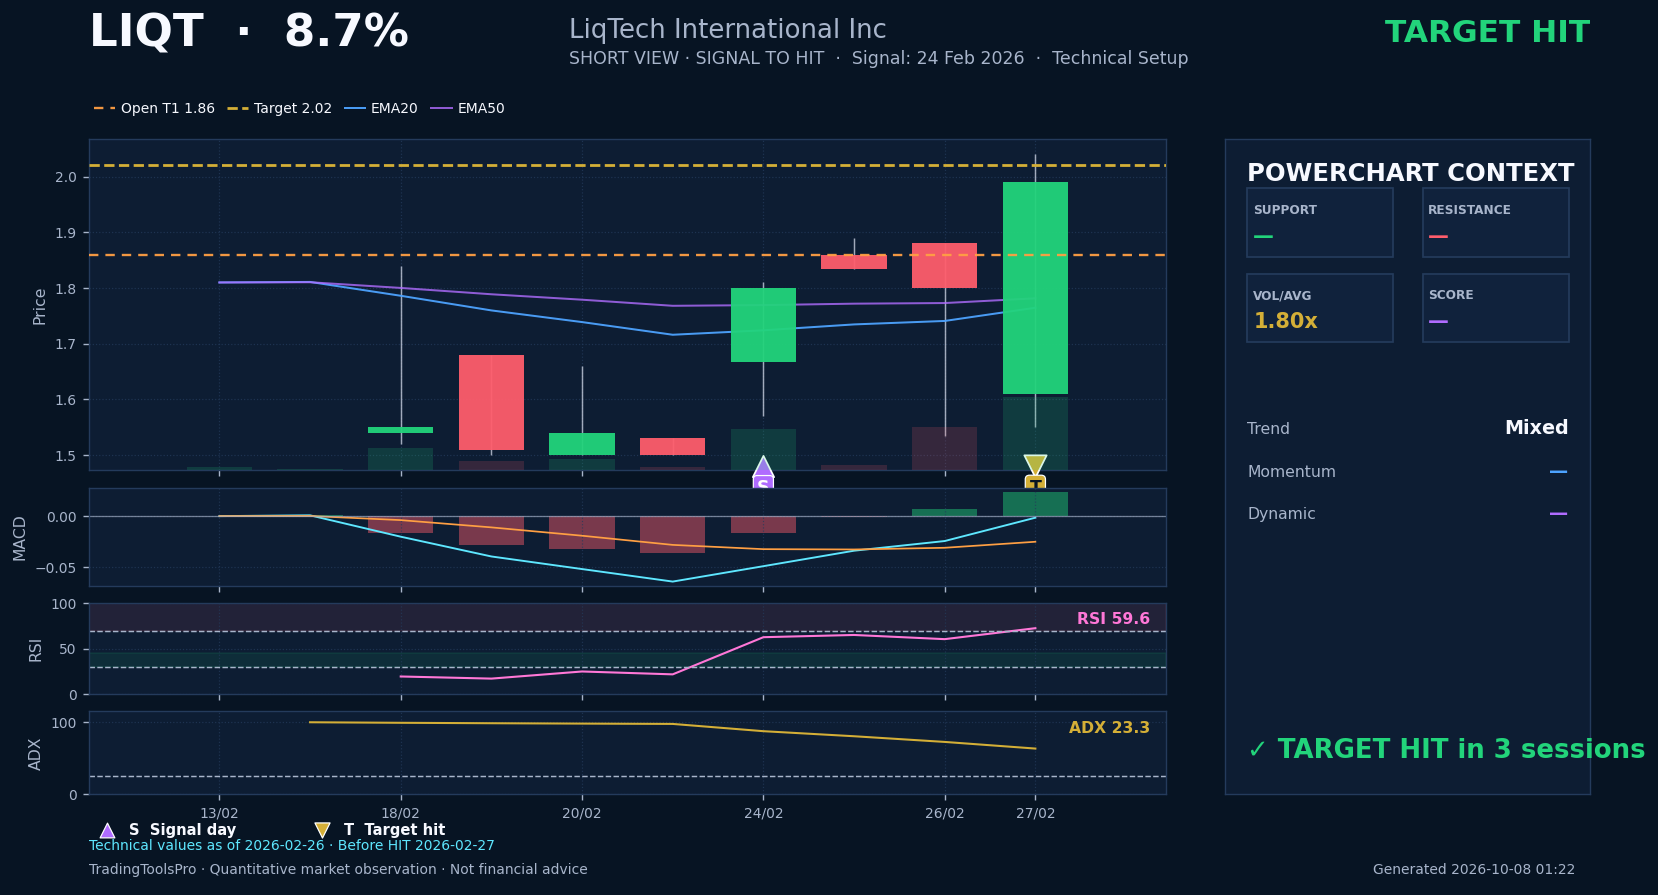 Open real PowerChart →
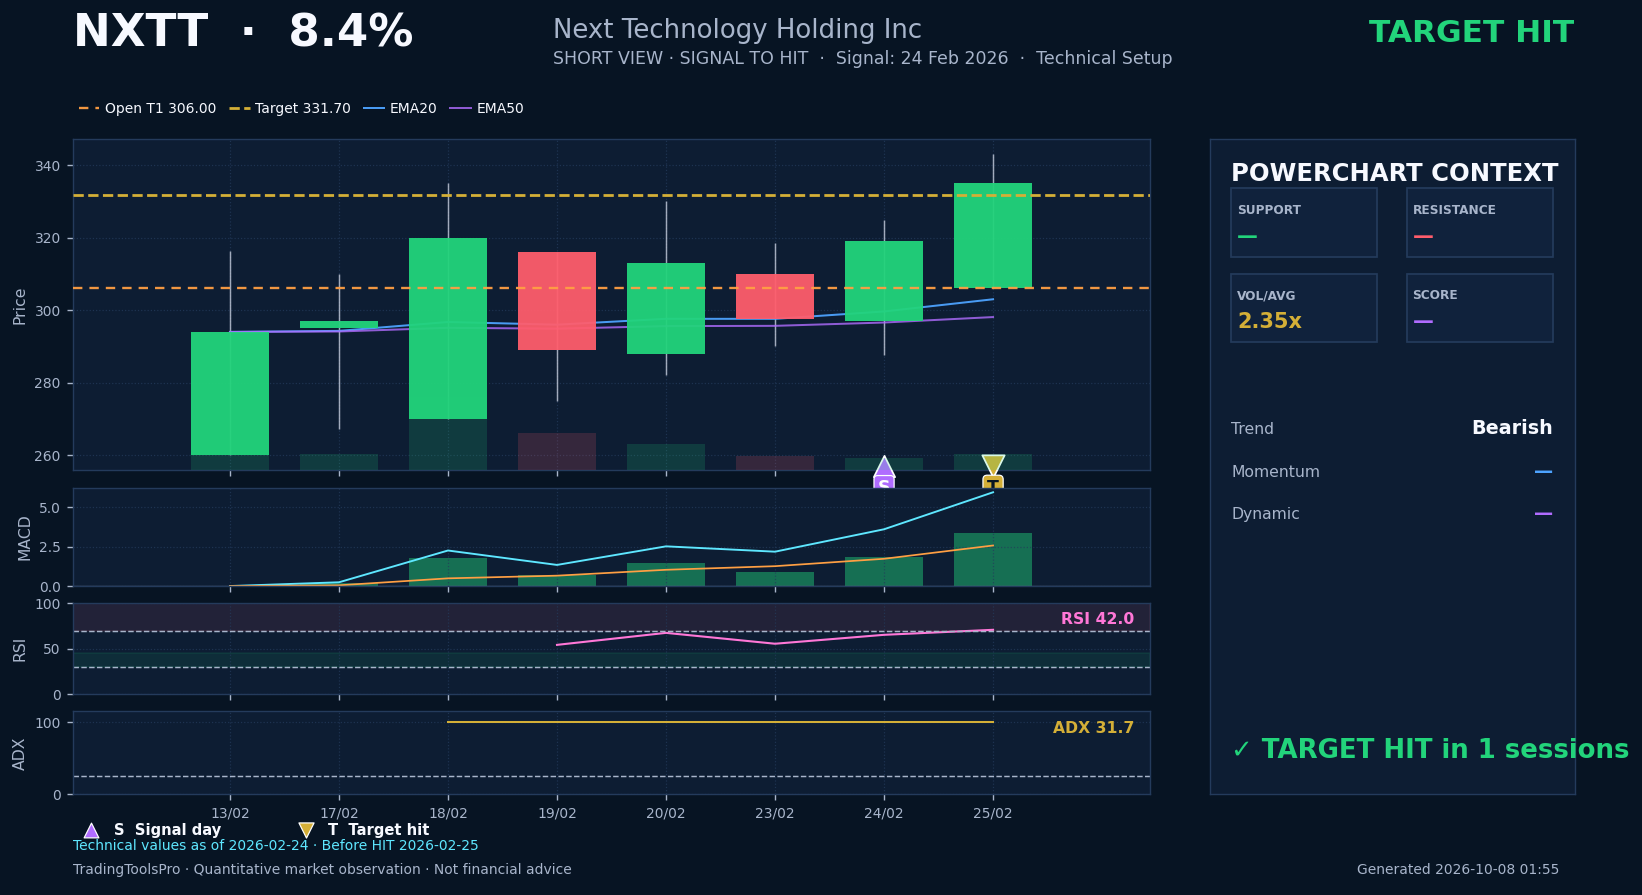 Open real PowerChart →
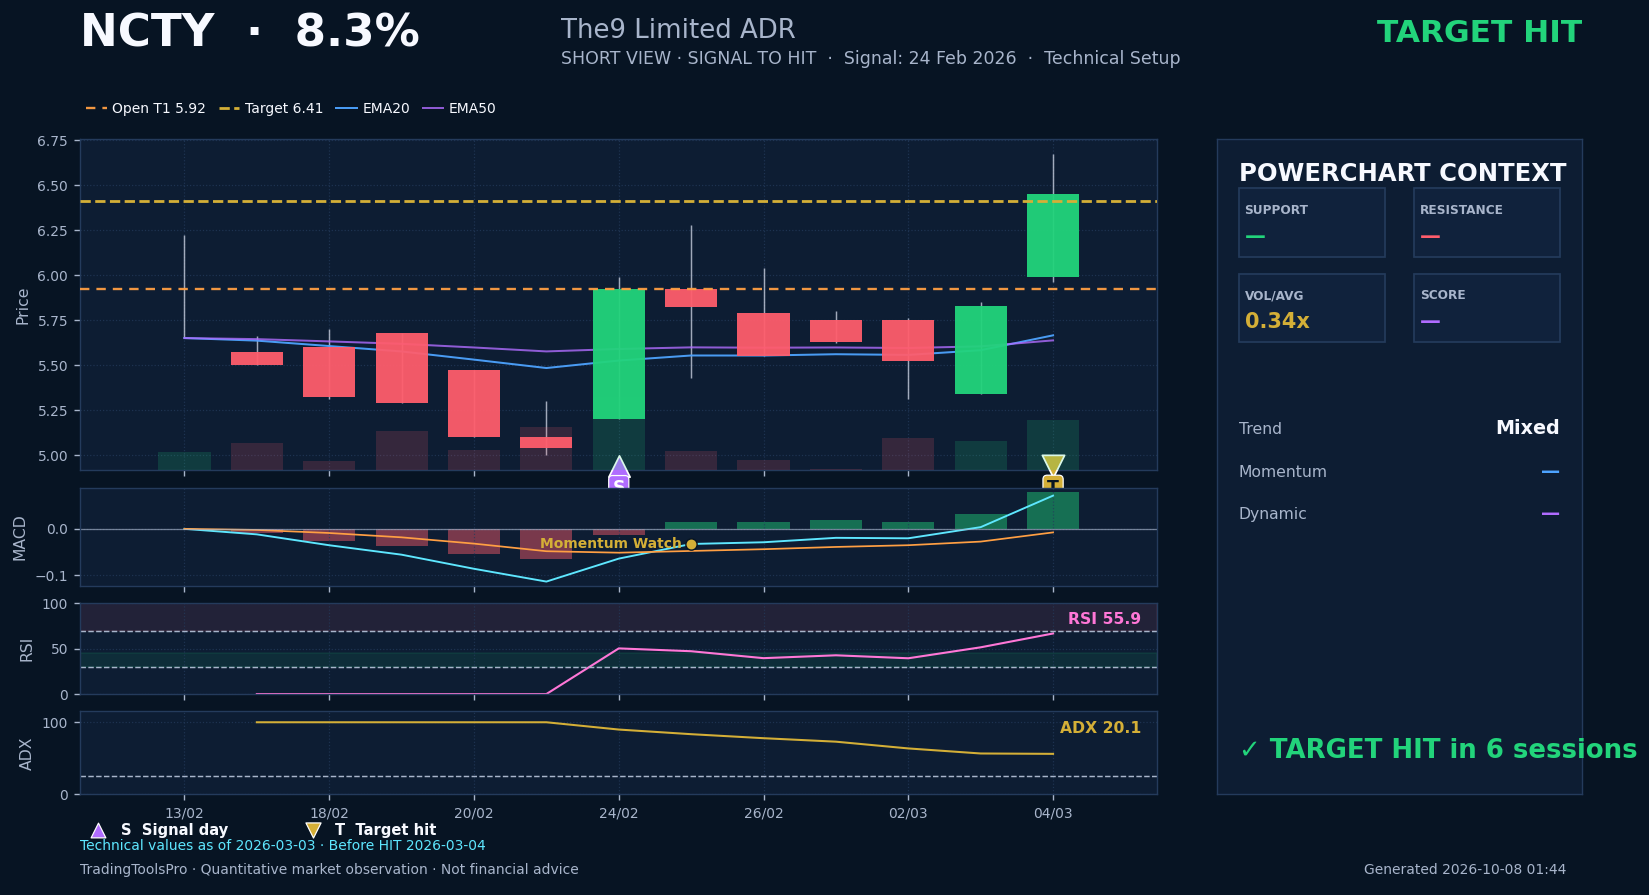 Open real PowerChart →
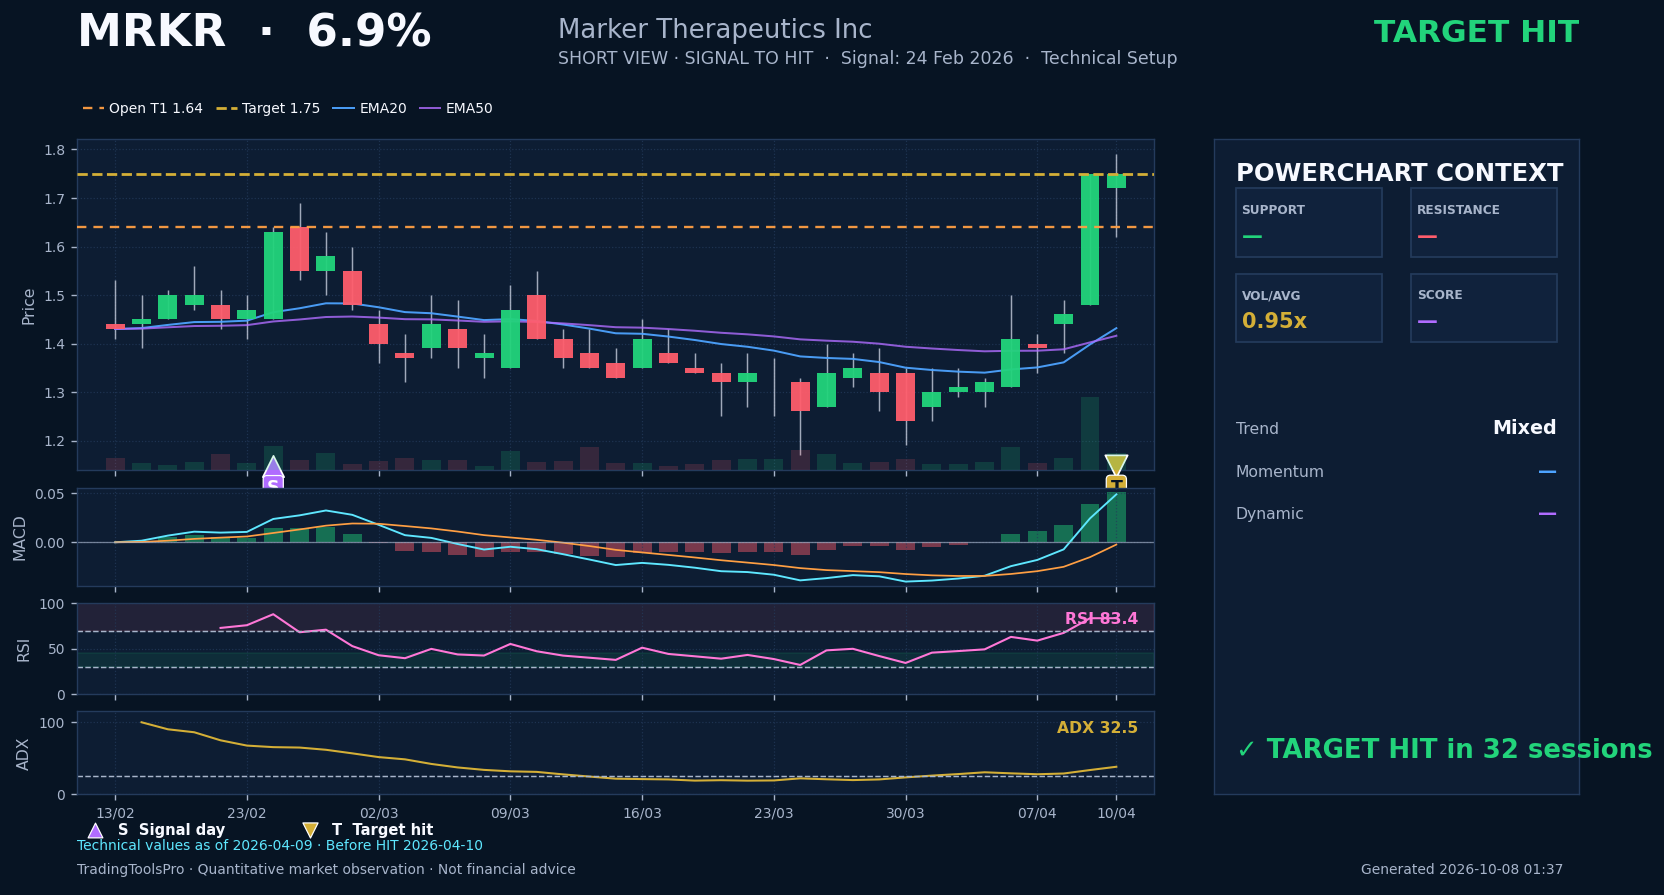 Open real PowerChart →
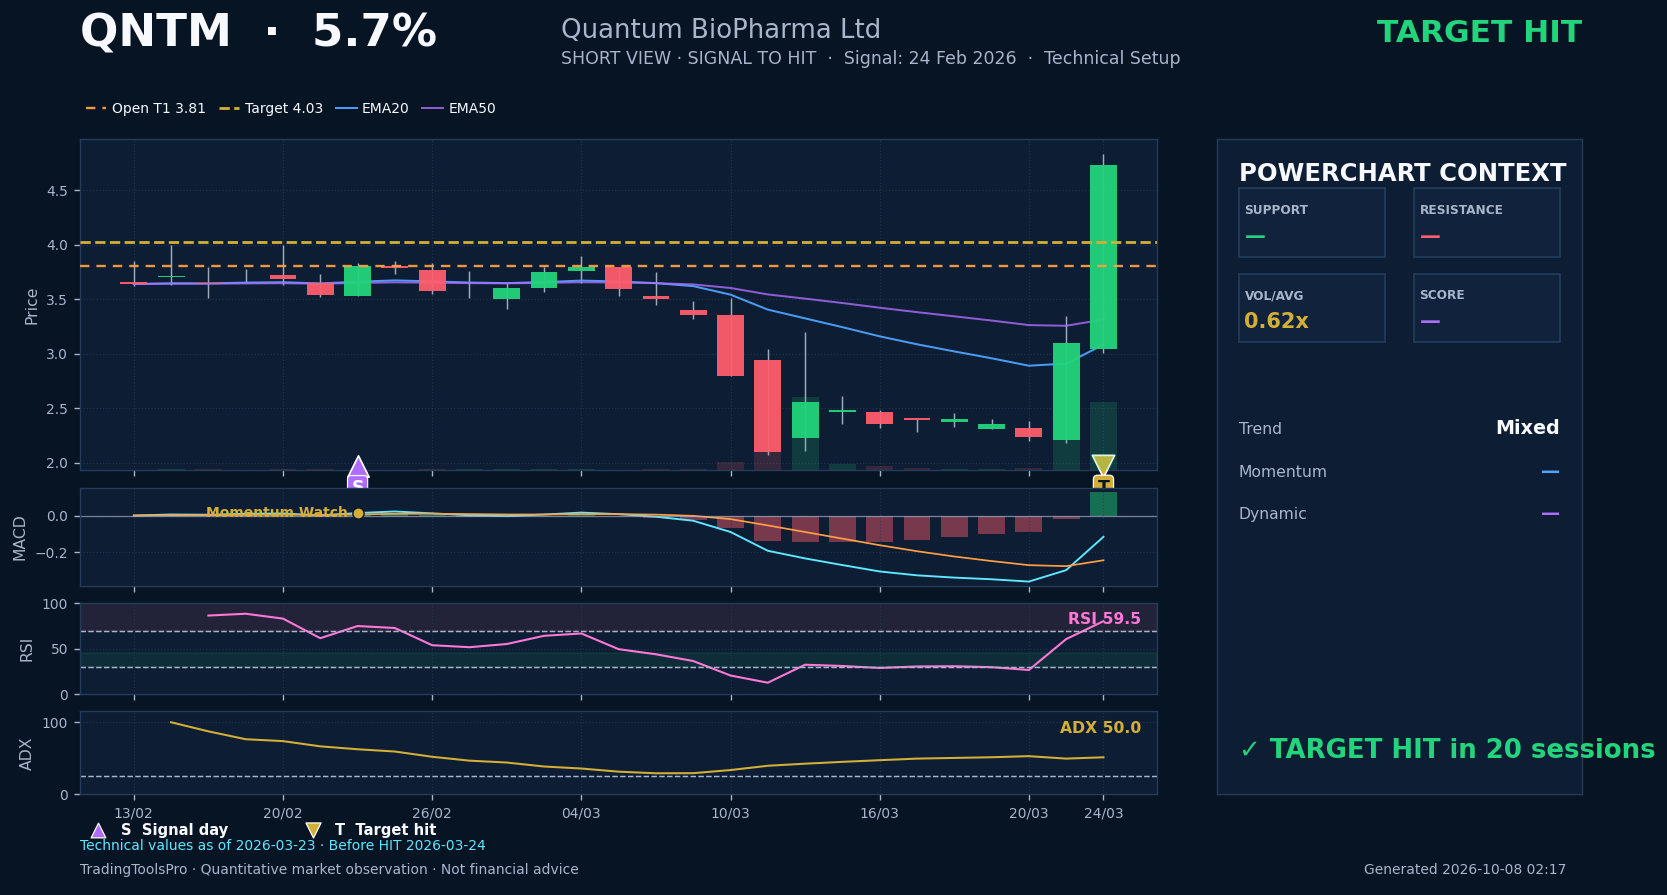 Open real PowerChart →
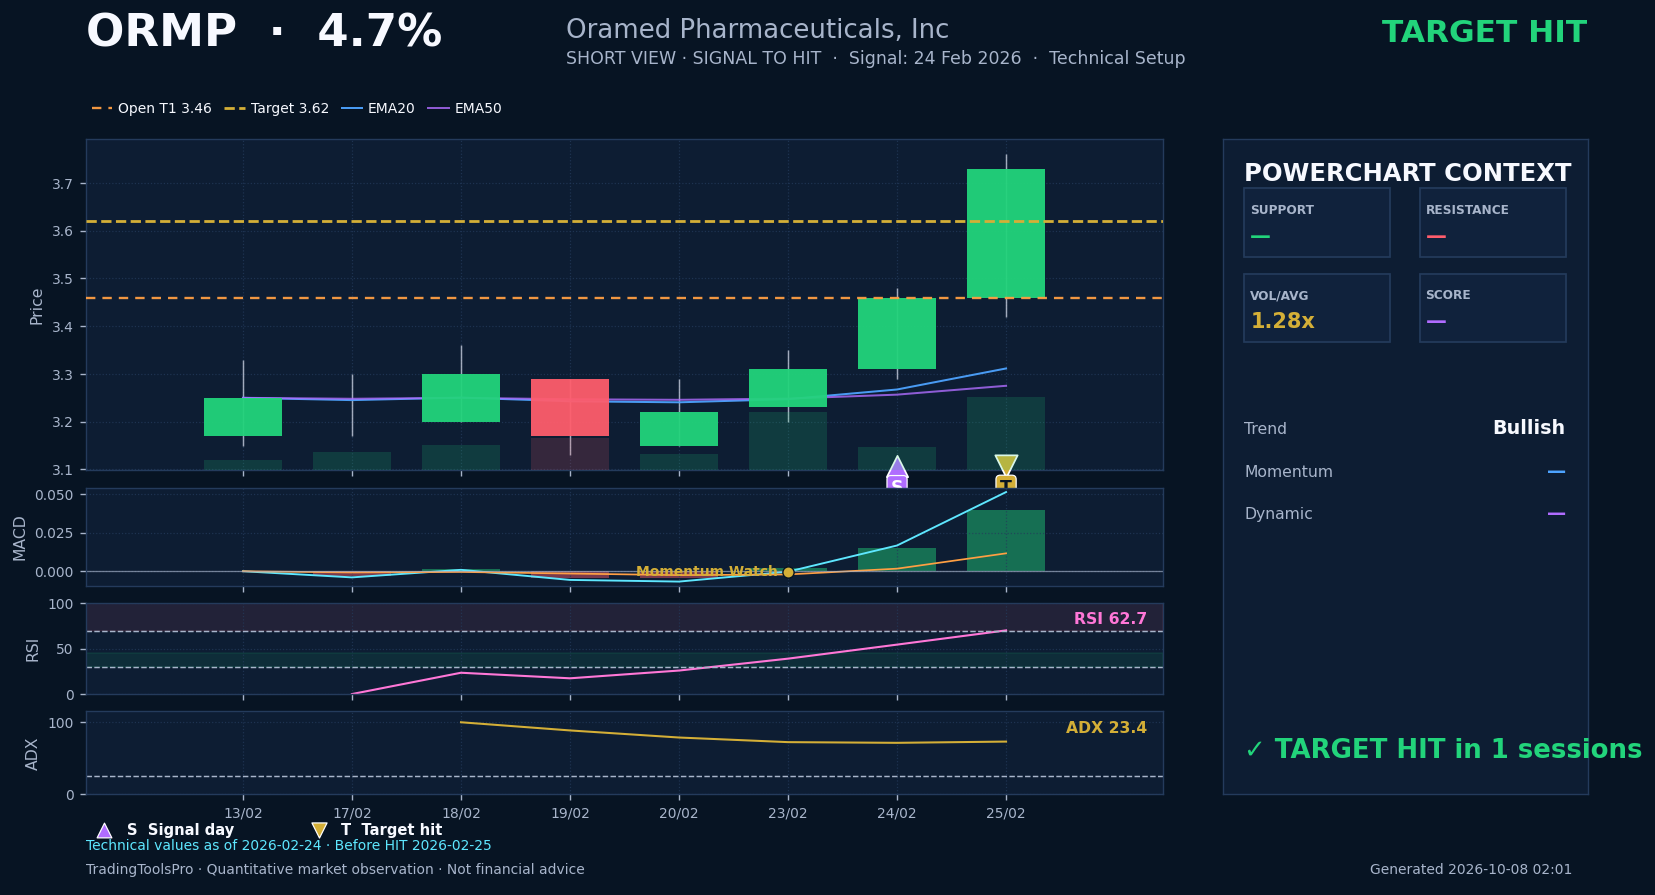 Open real PowerChart →
This historical day illustrates how the dashboard works; it is not an estimate of overall performance. The complete February example is public, including its OPEN setup.
How to read these results →Explore price action, candlesticks, targets and technical indicators together.
Discover the PowerChart →Same daily selection. Choose the amount of analysis you want.
All indicators and technical values, Full / Short PowerCharts and compact chart cards.
Try Elite →Ticker, target, status, indicators and technical values. Charts and mini-charts are included only in Elite.
Try Pro →Ticker list, statistical target and HIT / OPEN status.
Try Essential →One-month trial on your selected plan. Card required; cancel before renewal.