
TWG
+21.0%✓ VERIFIED TARGET HIT
Signal 2026-10-15
HIT 2026-10-26 · 7 trading sessions
5,000+ U.S. stocks screened every trading evening. A shortlist with statistical targets, technical context and Elite PowerCharts — ready for your decisions.
Start my 1-month free trial →Explore the real dashboard →Card required. Cancel before renewal. Elite $99/month · Pro $49 · Essential $29.
Signal 2026-10-15
HIT 2026-10-26 · 7 trading sessions
Targets, chart previews and setup progress together. Explore a complete historical day.
See the Dashboard →02 · POWERCHARTCandles, key levels and technical indicators in one view.
Explore the PowerChart →03 · METHODOLOGYOpen T1, a fixed target and a traceable outcome.
See how it works →04 · RESULTSUnderstand each day’s completion and the time to target.
Understand the results →*Historical averages based on more than six months of tracking. Statistical price targets, not realized trading returns. Inspect the dated Results report →
Latest session: 2026-10-26. Explore the strongest confirmed target percentages and inspect their historical charts.
See the individual signals, their target percentages and time to target in the Results report.
Explore this session →Signal 2026-10-08
HIT 2026-10-16 · 6 trading sessions
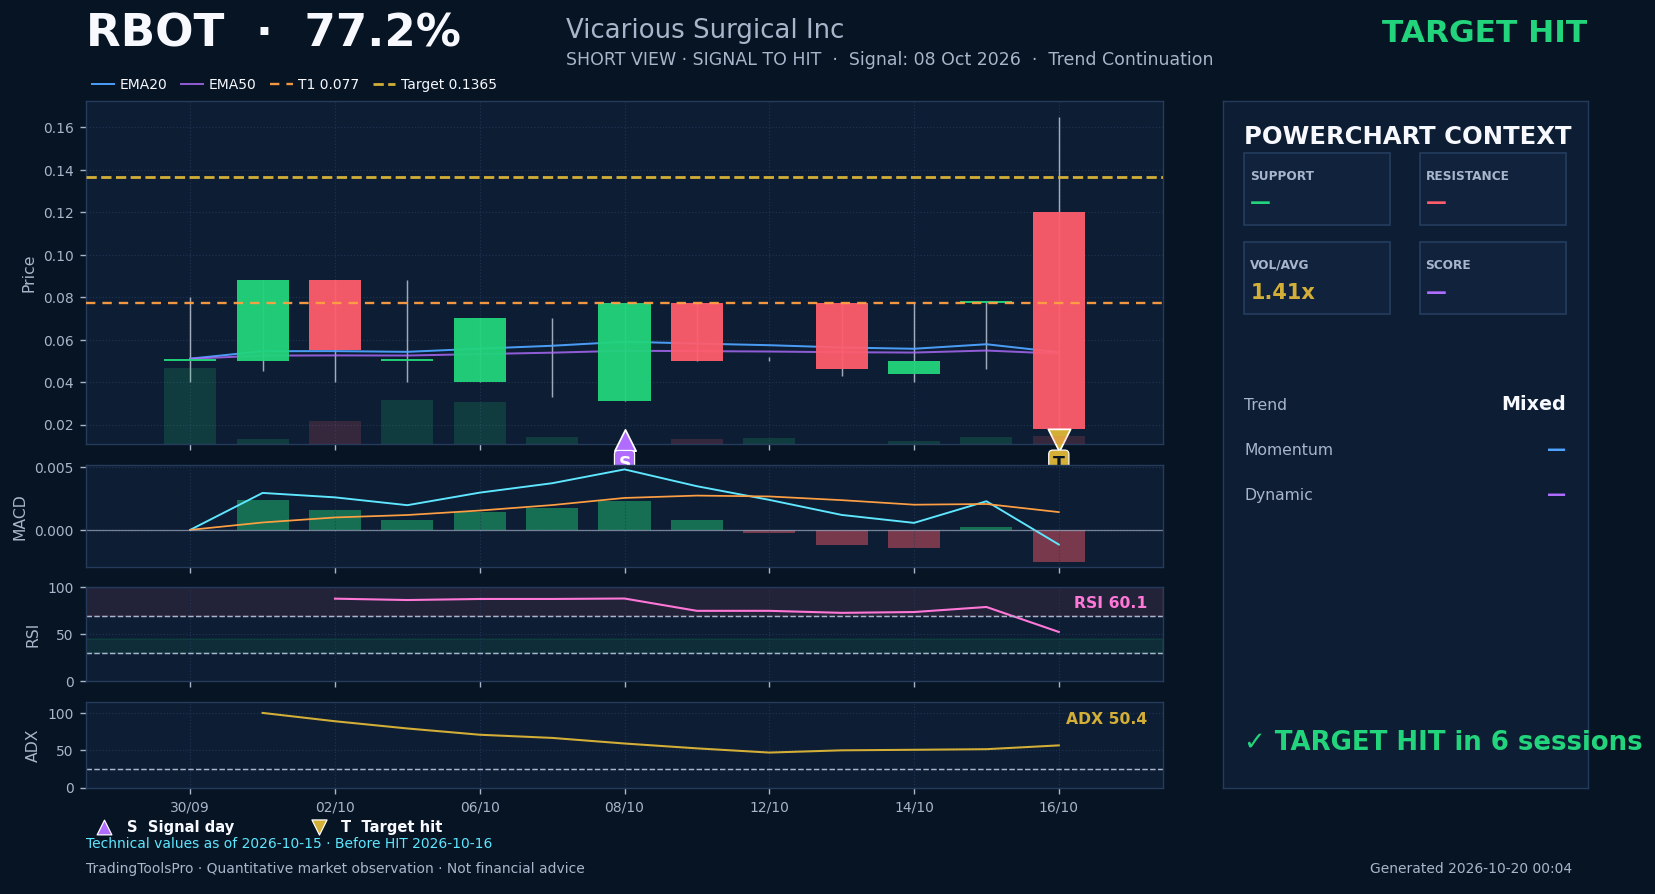 Open public PowerChart →
Signal 2026-10-13
HIT 2026-10-15 · 2 trading sessions
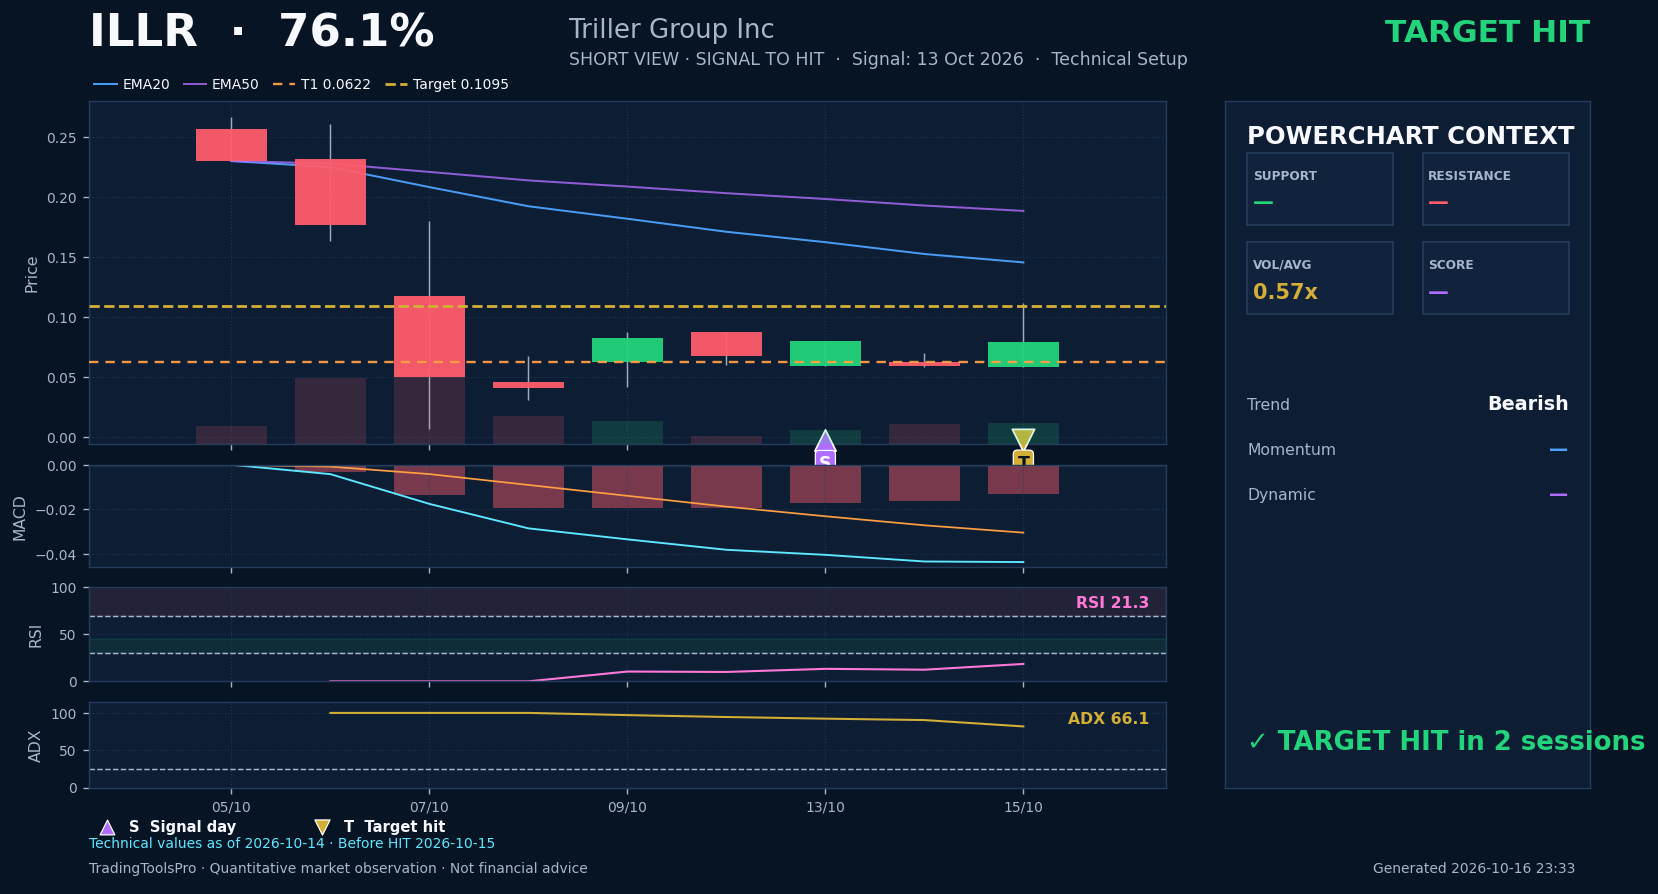 Open public PowerChart →
Signal 2026-06-01
HIT 2026-10-15 · 95 trading sessions
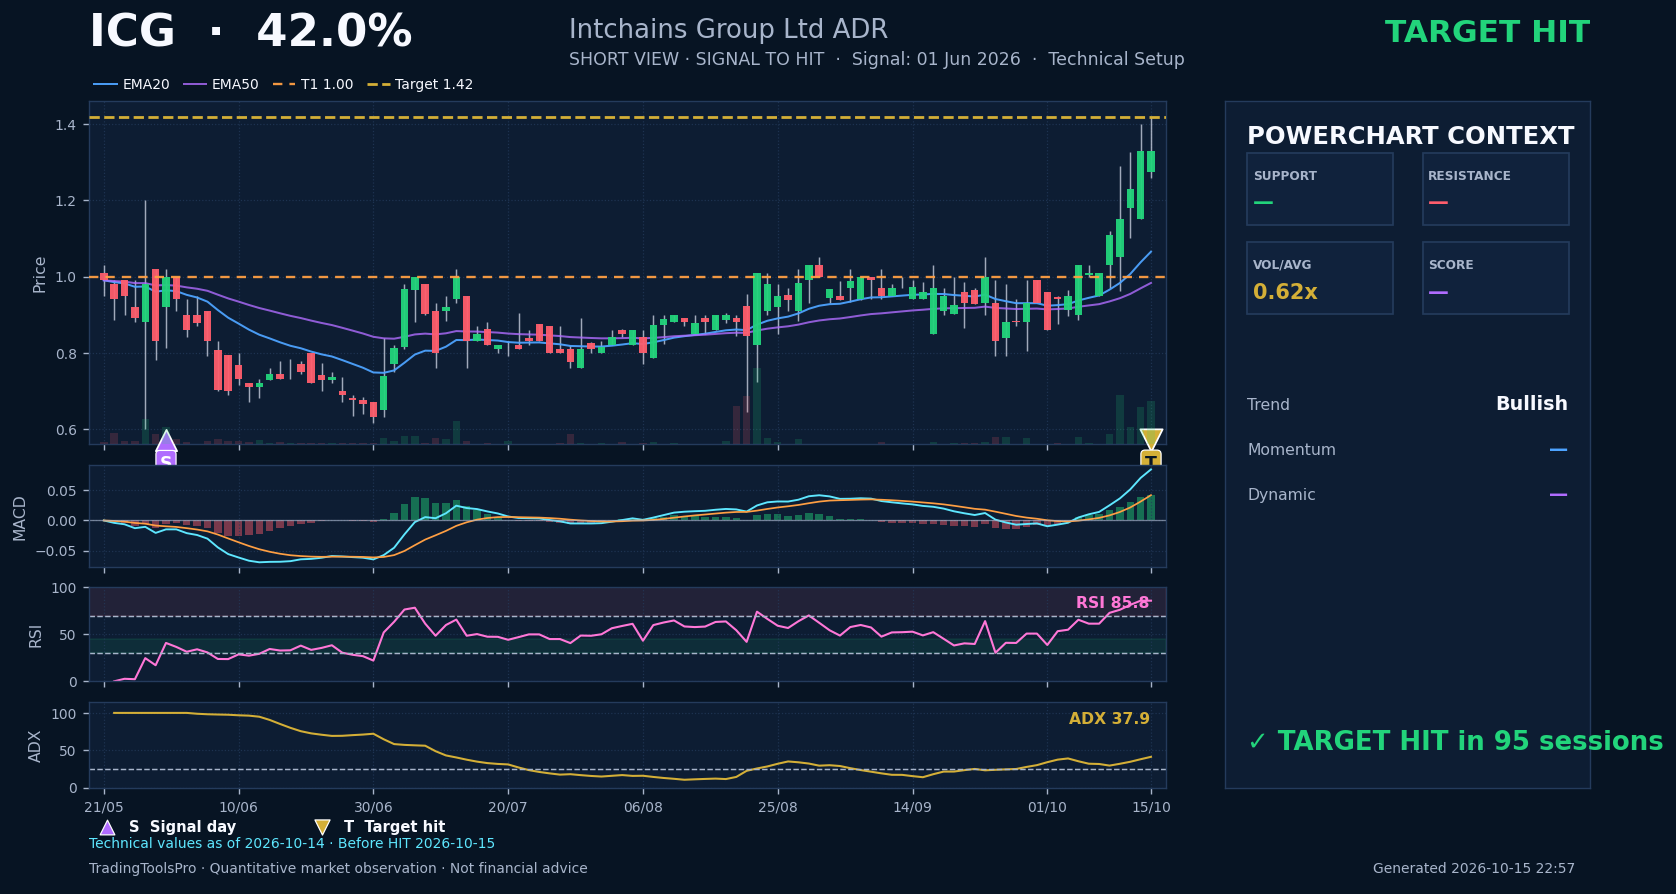 Open public PowerChart →
Signal 2026-04-14
HIT 2026-04-16 · 2 trading sessions
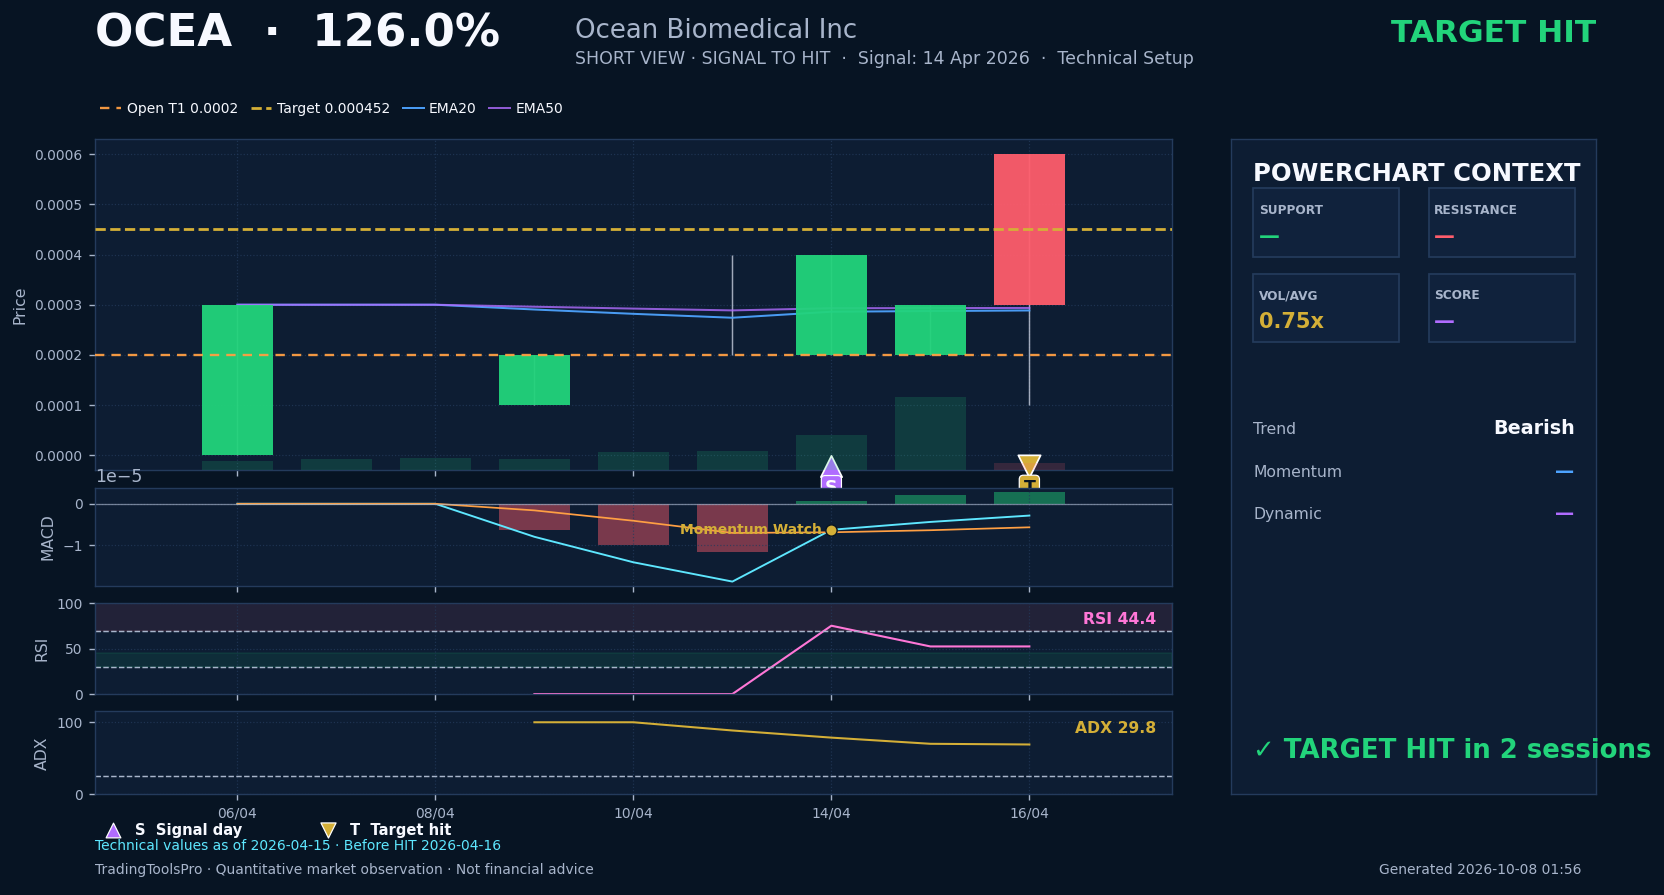 Open public PowerChart →
Signal 2026-06-26
HIT 2026-06-30 · 2 trading sessions
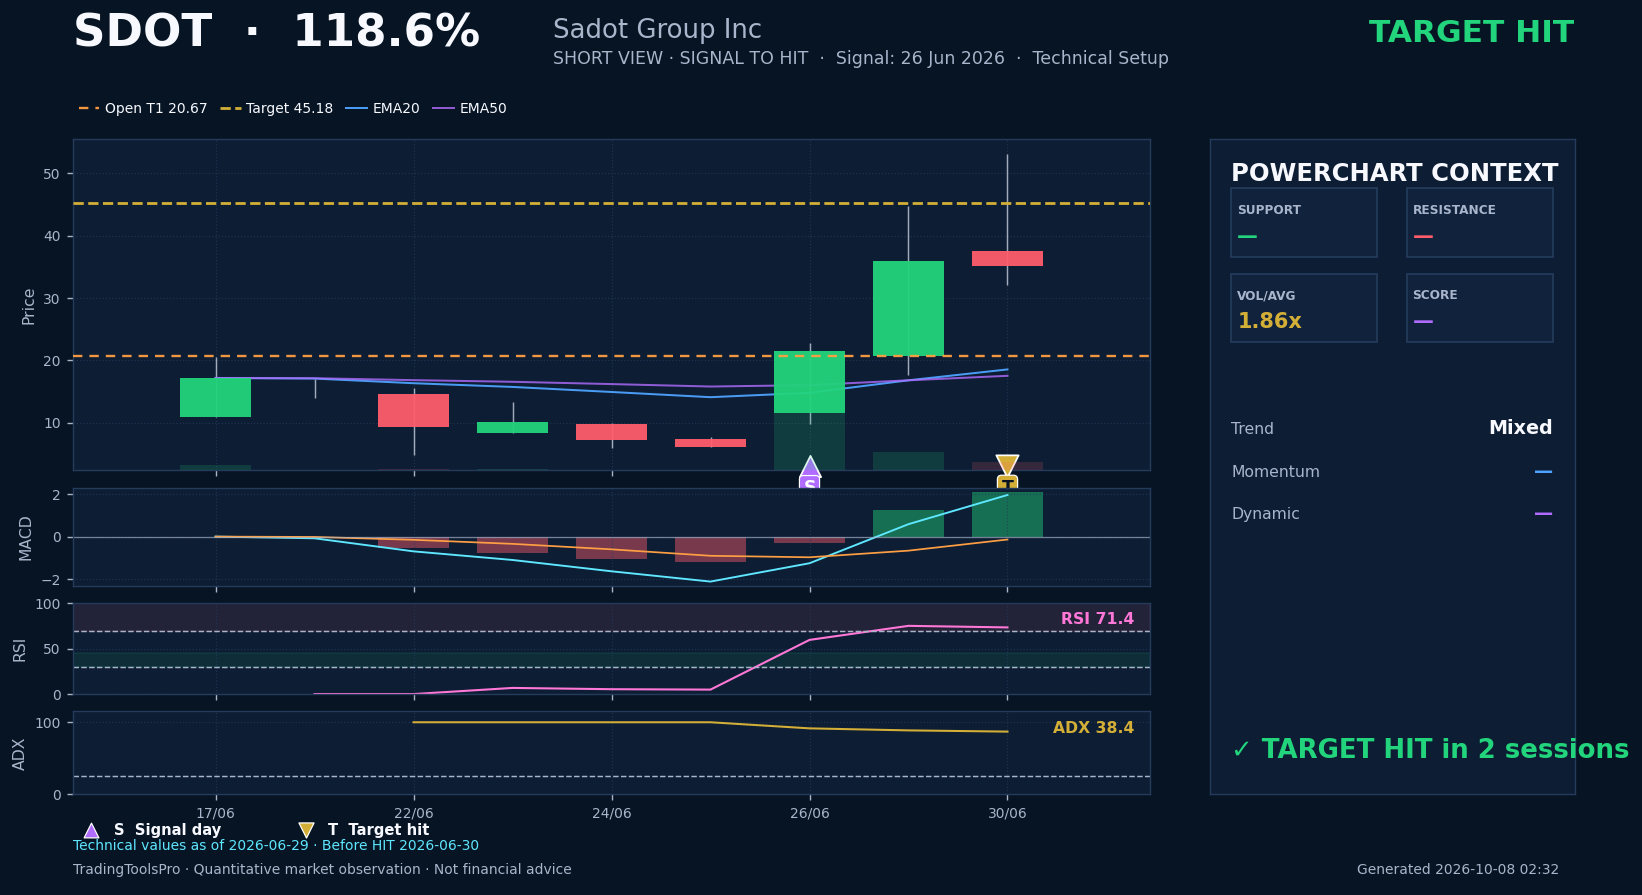 Open public PowerChart →
Signal 2026-06-04
HIT 2026-06-05 · 1 trading session
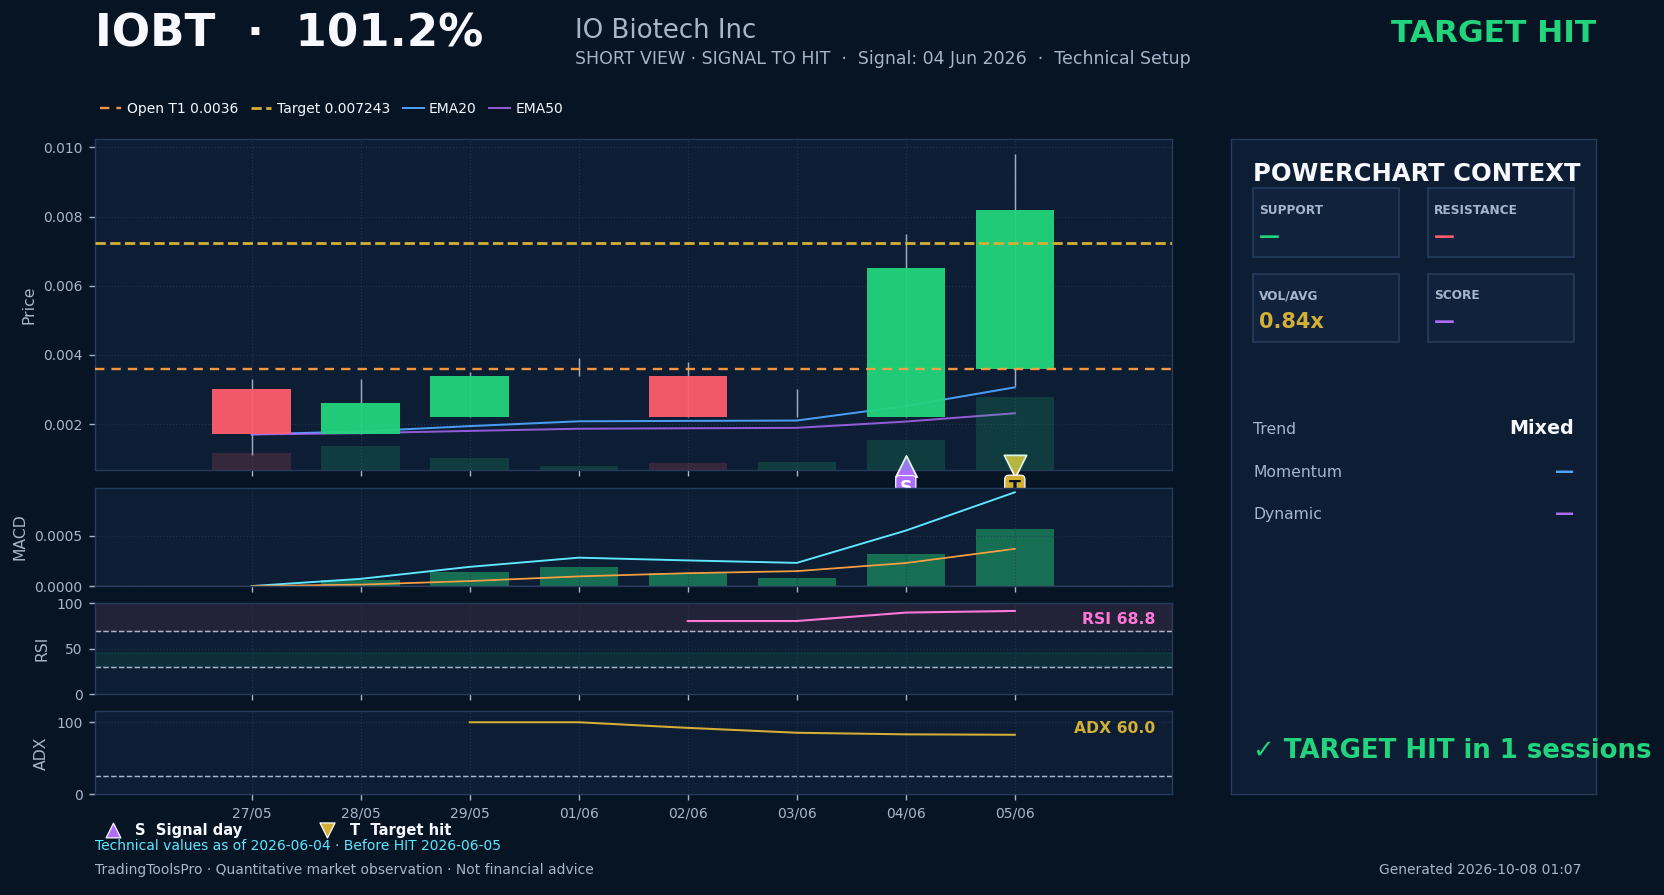 Open public PowerChart →
Ranked by statistical target percentage reached from Open T1, not by maximum subsequent price increase or realized return. Month is based on HIT date; each ranking shows the best recorded target per ticker. Standout examples do not represent all signals.
See all daily results →How to read the results →Statistical target from Open T1.
Unlock this stock →Statistical target from Open T1.
Unlock this stock →Statistical target from Open T1.
Unlock this stock →Current tickers and analysis are reserved for members. Higher target percentages do not imply higher success probabilities.
Inspect real historical charts and daily outcomes. Choose Essential for the list, Pro for technical values, or Elite for complete PowerCharts.
View Results →Compare plans →