
Price + candlesticks
See price structure and the available candle pattern with EMA 20/50.
Price action, candlestick patterns, key levels and technical indicators — together in one clear view. The key values are immediately visible beside the chart.
Read the shape of the candles and the detected pattern together with trend, volume and key levels. A pattern describes price behavior; it does not establish a certain outcome.
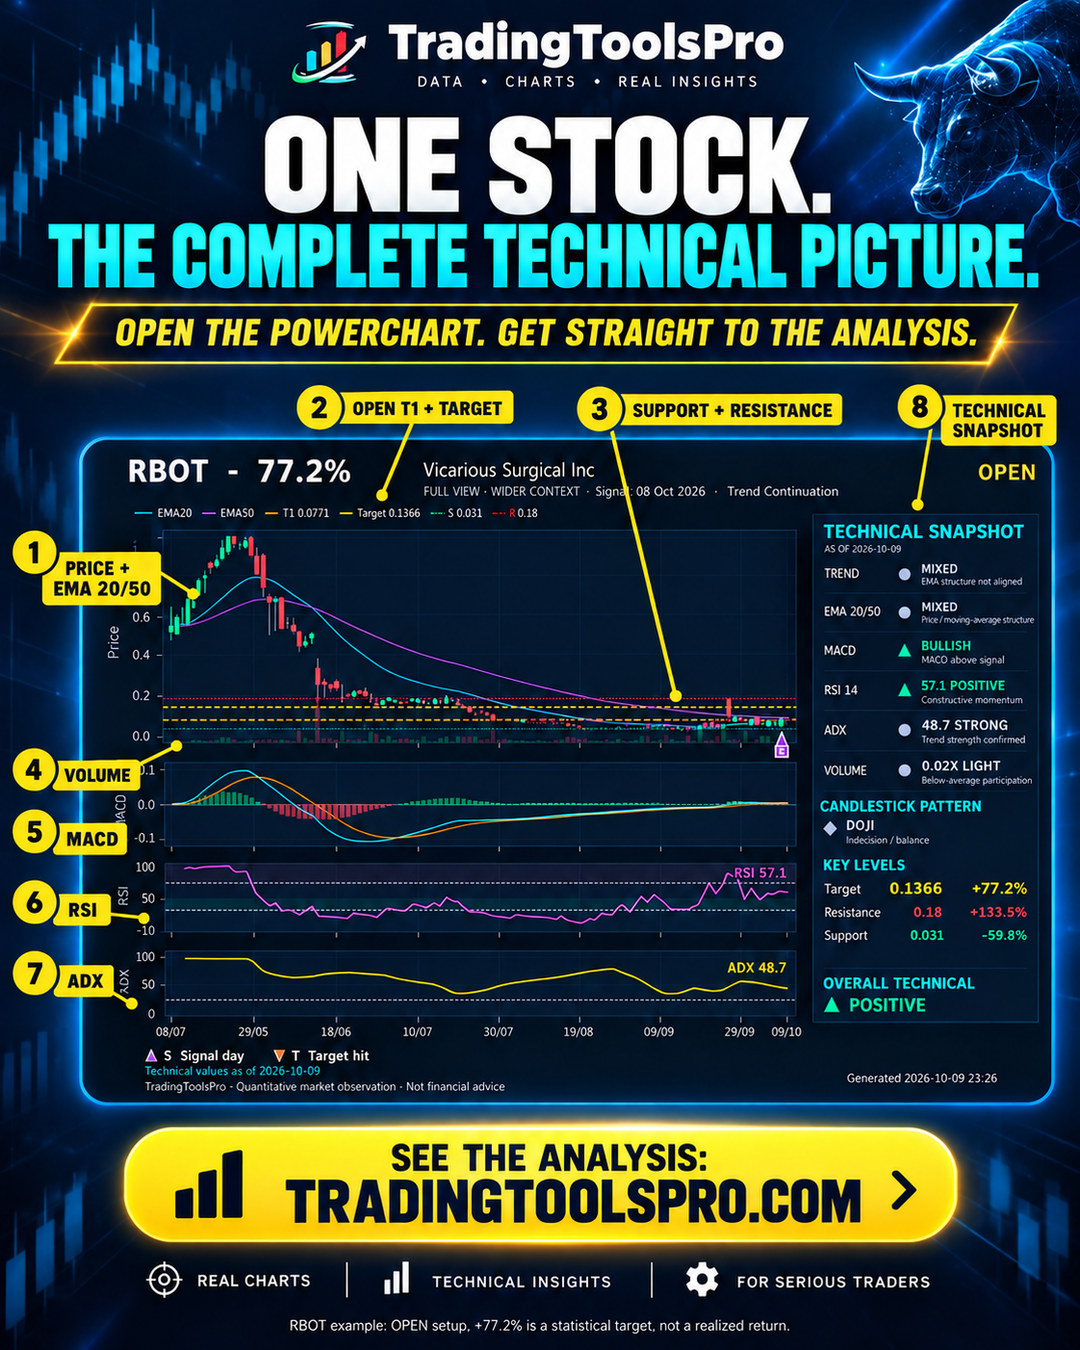
Historical illustration. The percentage shown is a statistical target from Open T1, not a realized return.
See price structure and the available candle pattern with EMA 20/50.
Locate Open T1, statistical target, support and resistance.
Compare trend, MACD, RSI, ADX, volume and overall context where values are available.
Check the setup date and status first. Public examples are historical; the member dashboard contains the latest selection.
Target from Open T1 measures the statistical price objective relative to the opening price of the next trading session. It is a reference level, not a guaranteed return.
Compare price action with support and resistance. These levels provide technical context for your own analysis.
Read score, RSI, momentum, volume and patterns where available. Missing values remain unavailable.
Short focuses on recent price action; Full adds broader historical context. Both are included in Elite.
Technical snapshot values for HIT signals refer to the preceding trading session; the chart includes the HIT candle. HIT means the target price was reached; OPEN means no confirmed hit is recorded. Consult Results for elapsed sessions and outcomes.
For confirmed HIT signals, the chart ends on the first target-hit session. Technical snapshot values refer to the preceding trading session. This pre-hit snapshot is distinct from the analysis originally issued on the signal date.
Explore the real historical HIT charts →Understand Open T1 and the target →